What is a “Linear Regression”-
Linear regression is one of the most powerful and yet very simple machine learning algorithm. Linear regression is used for cases where the relationship between the dependent and one or more of the independent variables is supposed to be linearly correlated in the following fashion-
Y = b0 + b1*X1 + b2*X2 + b3*X3 + …..
Here Y is the dependent variable and X1, X2, X3 etc are independent variables. The purpose of building a linear regression model is to estimate the coefficients b0, b1, b2 et cetera that provides the least error rate in the prediction. More on the error will be discussed later in this article.
In the above equation, b0 is the intercept, b1 is the coefficient for variable X1, b2 is the coefficient for the variable X2 and so on…
What is a “Simple Linear Regression” and “ Multiple Linear Regression”?
When we have only one independent variable, resulting regression is called a “Simple Linear Regression” when we have 2 or more independent variables the resulting regression is called “Multiple Linear Regression”
What are the requirements for the dependent and independent variables in the regression analysis?
The dependent variable in linear regression is generally Numerical and Continuous such as sales in dollars, gdp, unemployment rate, pollution level, amount of rainfall etc. On the other hand, the independent variables can be either numeric or categorical. However, please note that the categorical variables will need to be dummy coded before we can use these variables for building a regression model in the sklearn library of Python.
What are some of the real world usage of linear regression?
As we discussed earlier, this is one of the most commonly used algorithm in ML. Some of the use cases are listed below-
Example 1-
Predict sales amount of a car company as a function of the # of models, new models, price, discount,GDP, interest rate, unemployment rate, competitive prices etc.
Example 2-
Predict weight gain/loss of a person as a function of calories intake, junk food, genetics, exercise time and intensity, sleep, festival time, diet plans, medicines etc.
Example 3-
Predict house prices as a function of sqft, # of rooms, interest rate, parking, pollution level, distance from city center, population mix etc.
Example 4-
Predict GDP growth rate as a function of inflation, unemployment rate, investment, new business, weather pattern, resources, population
How do we evaluate linear regression model’s performance?
There are many metrics that can be used to evaluate a linear regression model’s performance and choose the best model. Some of the most commonly used metrics are-
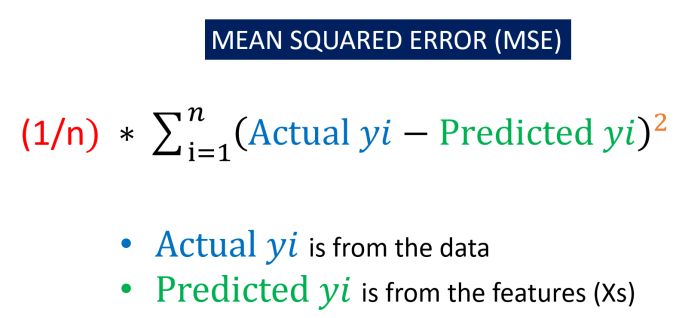
Mean Square Error (MSE)- This is an error and lower the amount the better it is. It is defined using the below formula
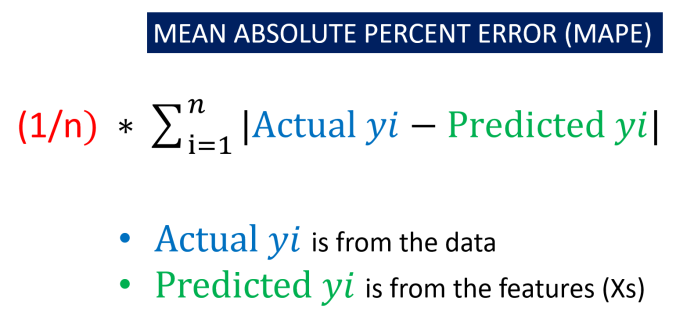
Mean Absolute Percent Error (MAPE)- This is an error and lower the amount the better it is. It is defined using the below formula
R Square– This is called coefficient of determination and provides a gauge of model’s explaining power. For example, for a linear regression model with a RSquare of 0.70 or 70% would imply that 70% of the variation in the dependent variable can be explained by the model that has been built.
How do we build a linear regression model in Python?
In this exercise, we will build a linear regression model on Boston housing data set which is an inbuilt data in the scikit-learn library of Python. However, before we go down the path of building a model, let’s talk about some of the basic steps in any machine learning model in Python
In most cases, any of the machine learning algorithm in sklearn library will follow the following steps-
- Split original data into features and label. In other words, create dependent variable and set of independent variables in two different arrays separately. Please note this requirement exists only for the supervised learning ( where a dependent variable is present). For unsupervised learning, we don’t have a dependent variable and hence there is no need to split the data into features and label
- Scale or Normalize the features and label data. Please note that this is not a necessity for all algorithms and/or datasets. Also we are assuming that all the data cleaning and feature engineering such as missing value treatment, outlier treatment, bogus values fixes and dummy coding of the categorical variables have been done before doing this step
- Create training and test data sets from the original data. Training data set will be used for training the model whereas the test data set will be used for validating the accuracy or the prediction power of the model on a new dataset. We would need to split both the features and labels into the training and the test split.
- Create an instance of the model object that will be used for the modelling exercise. This process is called “Instantiation”. In simpler words, during this process we are loading the model package necessary to build a model.
- “Fit” the model instance on the training data. During this step, the model is leveraging both the features and the label information provided in the training data to connect the features to label. Please note that we are going with all the default option during fitting of the model. As you get more expertise you may want to play with some parameter optimization, however we are just going with the defaults for now.
- “Predict” using the model instance on test data. During this step, the model is only using the features information to predict the label.
- Based on the predictions generated on the test data, we generate key performance indicators of model performance. This generally includes metrics such as Precision, Recall F score, Confusion Matrix, Accuracy, Mean Square Error (MSE), Root Mean Square Error (RMSE), Mean Absolute Error (MAE), Area Under the Curve (AUC), Mean Absolute Percentage error (MAPE) etc.
- Once the model performance is evaluated and its deemed to be satisfactory for the purpose of the business uses, we implement the model for new unseen data
So let’s get started with building this model-
- import the necessary packages including the train_test_split package which will be used for splitting the data into the training and test samples
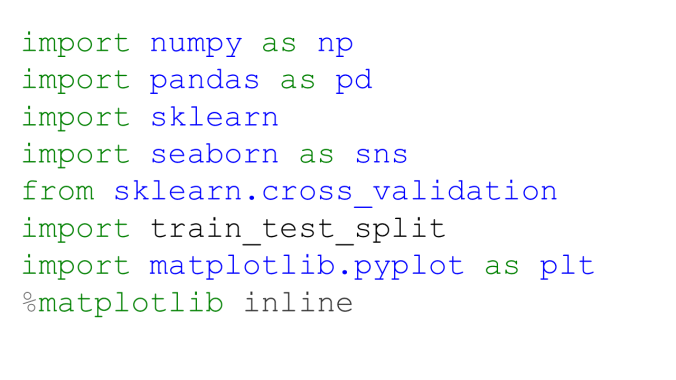
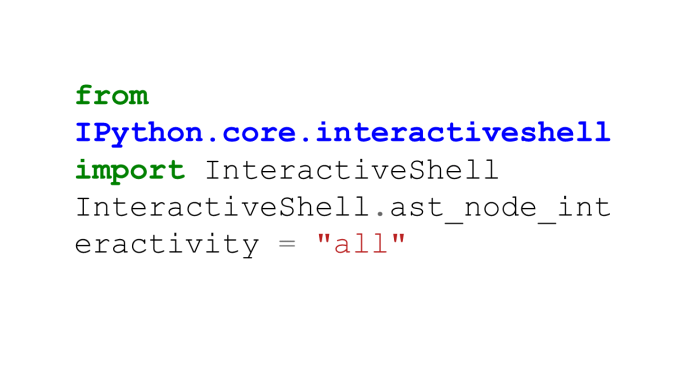
- Import interactive shell magic command which will help us print many statements on the same line
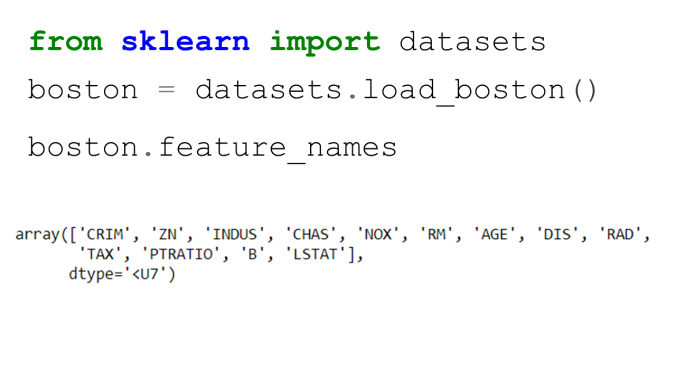
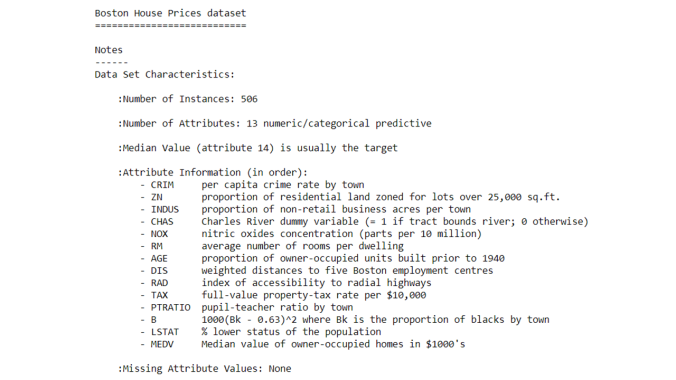
- Import the Boston Housing dataset from sklearn library. Python has many such inbuilt datasets for various purposes. Most of the data sets in such libraries are stored as dictionary format.
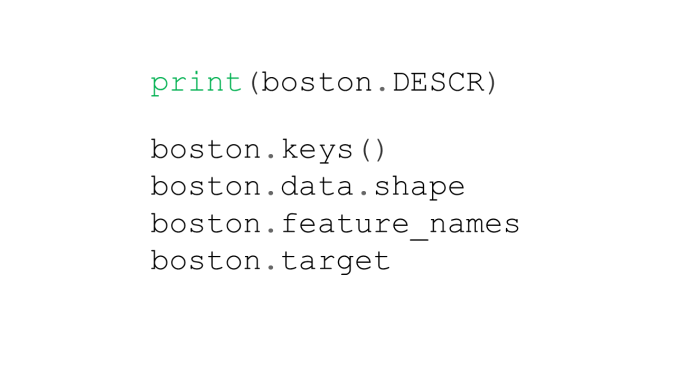
- Find out more about this data set by typing the below command
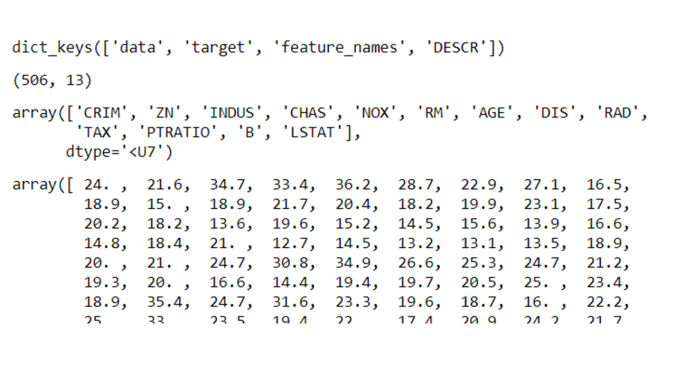
- Let’s do some more exploratory analysis such as- printing the features, the label shape of the data etc.
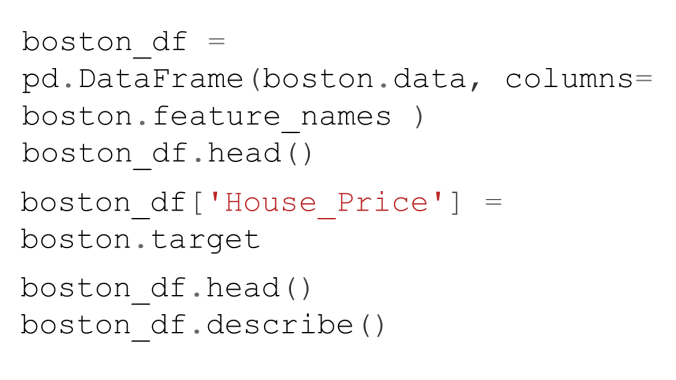
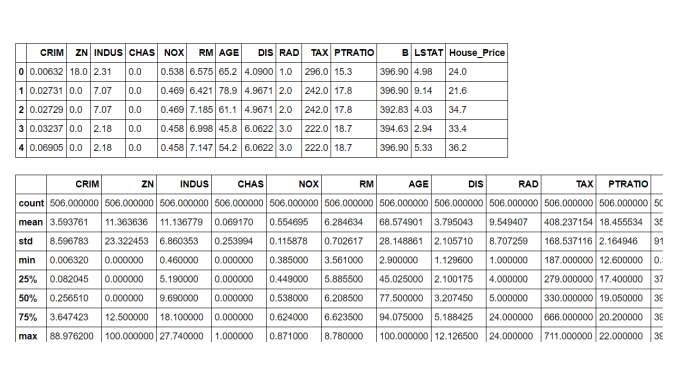
- Convert the original array data into a dataframe and append the column names.
- Add a new variable in the dataframe for the target ( or label) variable
- Since we are building a linear regression model it may be helpful to generate the correlation matrix and then the correlation heatmap using the seaborn library
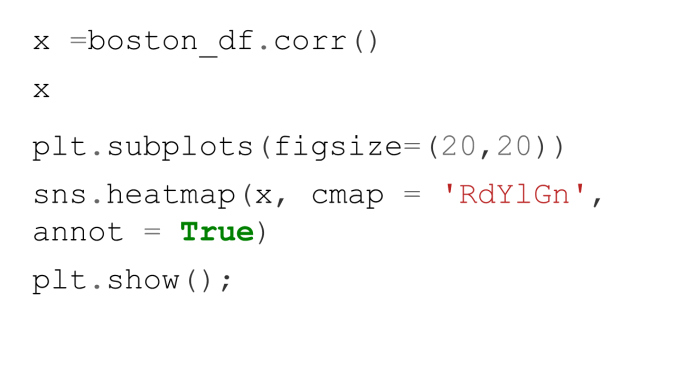
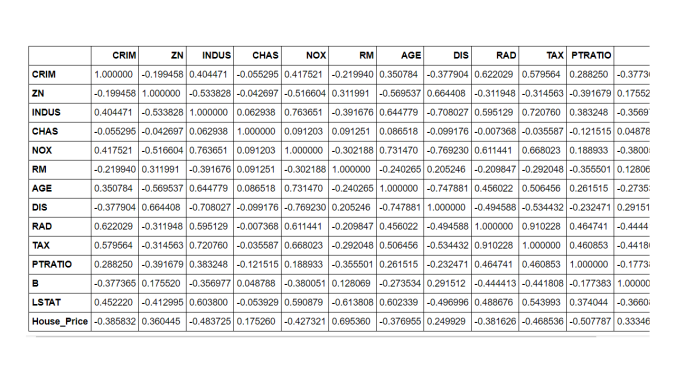
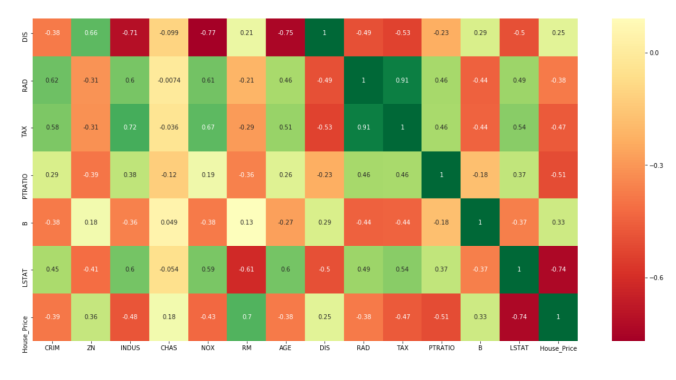
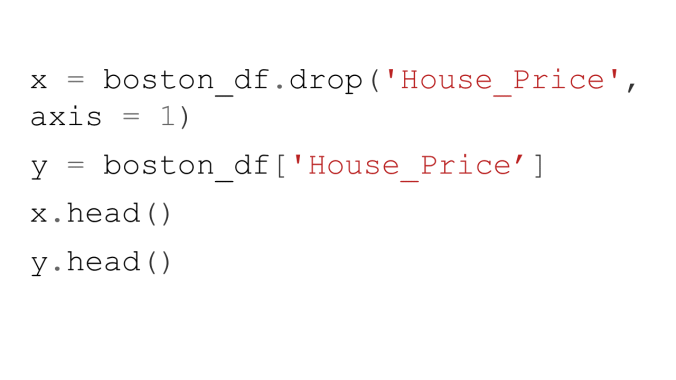
- Create features and labels using Pandas ‘.drop() ‘ method to drop certain variables. In this case we are dropping the house price as this is the label.
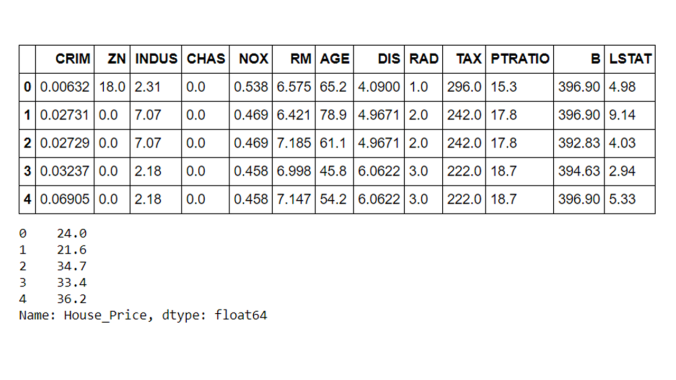
- Split the data into the training and test datasets
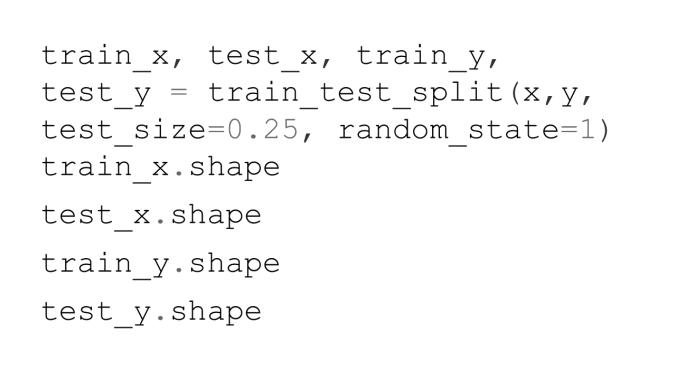

- Instantiate– import the model object and create an instance of the model
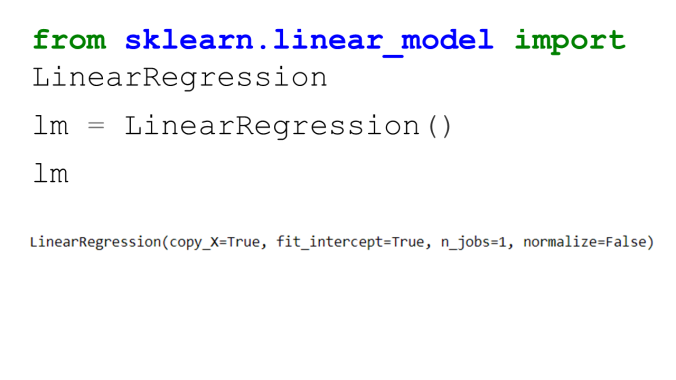
- Fit – Fit the model instant on the training data using ‘ .fit() ‘ method. Note that we are passing on both the features and label here
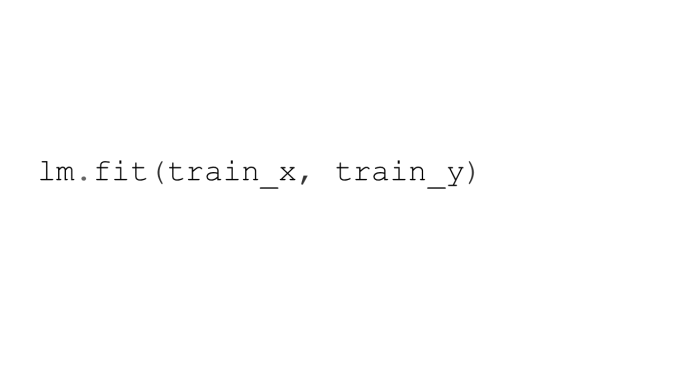
- Predict– Predict using the model instant and training done on the training data using ‘ .predict() ‘ method. Please note that here we are only passing on the features and having the model predict the values of the label.

- We can find out many important things such as the coefficients of the parameters using the fitted object methods. In the below case, we are getting the coefficient values for all the feature parameters in the model.
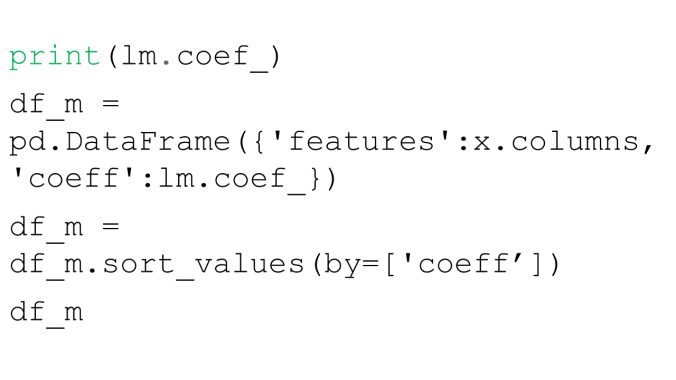
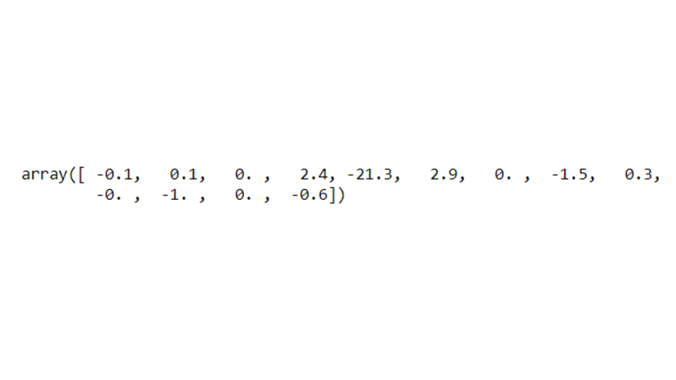
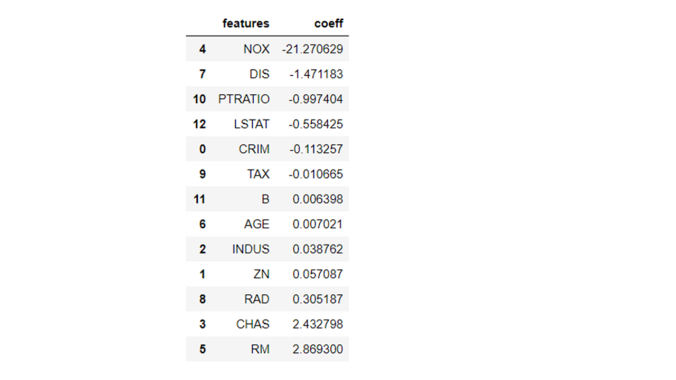
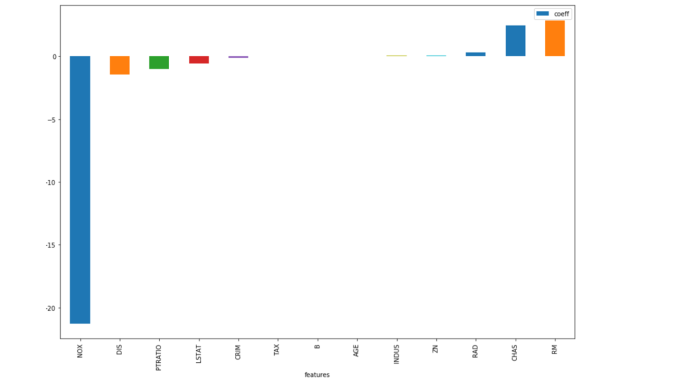
- We can plot the feature importance in a bar chart format as well using the ‘.plot’ method of the Pandas dataframe. Please note that we can also specify the figure size and the X and Y variables in the plot method under the different parameters possible

- Let’s now generate some of the model performance metrics such as R2, MSE and MAE. All of these model performance metrics can be generated using the scikit-learn inbuilt packages such as ‘metrics’.
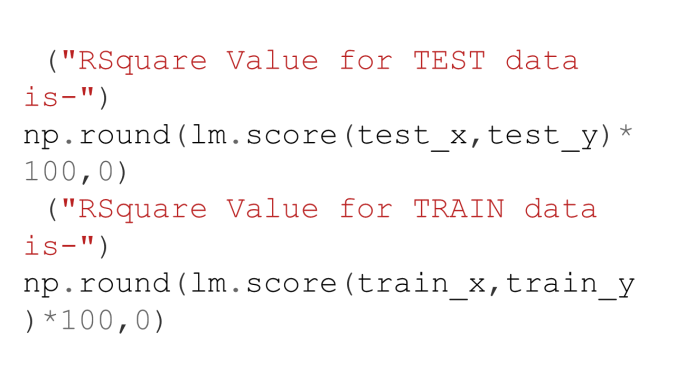
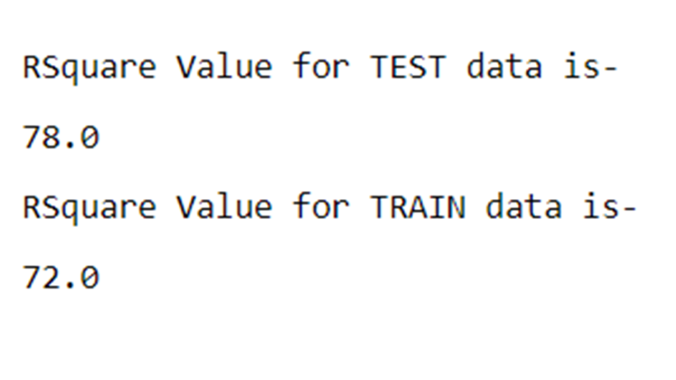
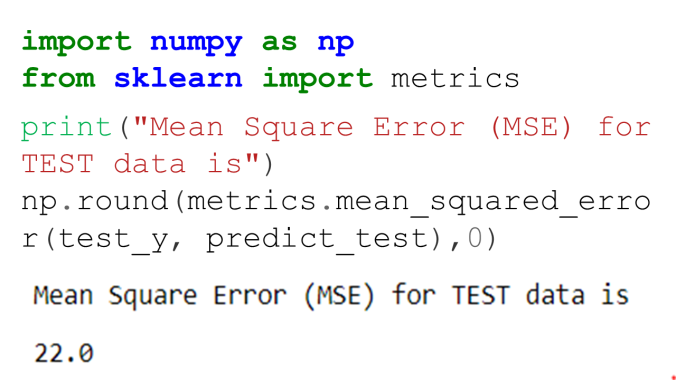
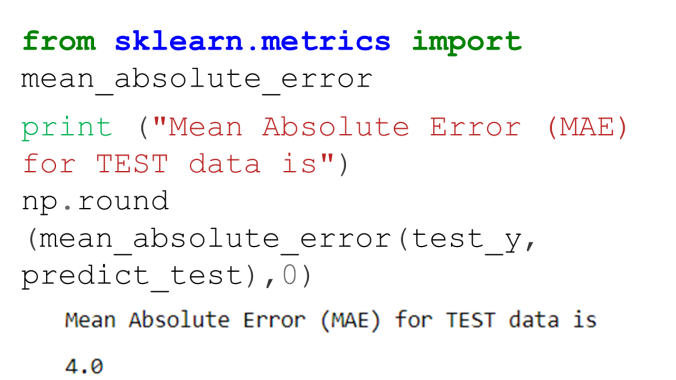
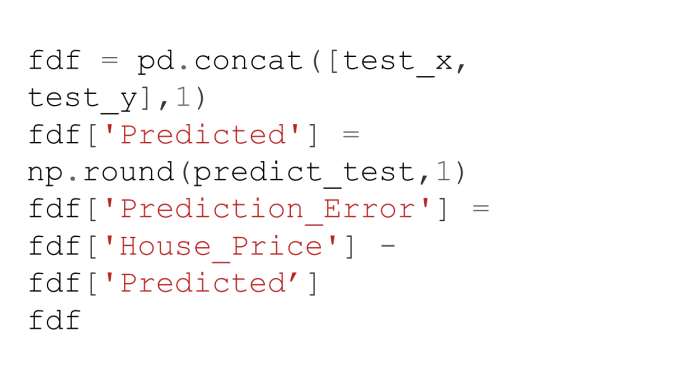
- In the last step we are appending the predicted house prices into the original data and computing the error in estimation for the test data.
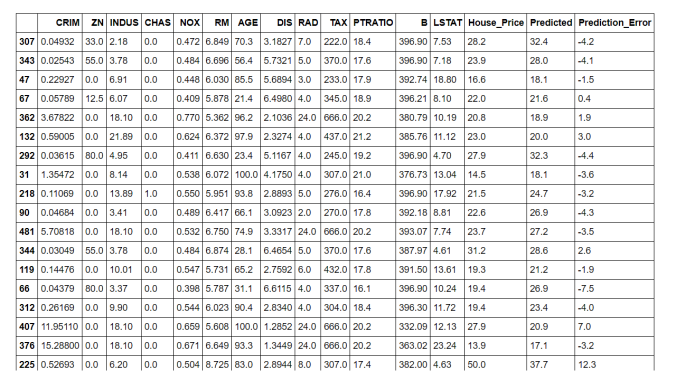
As you can see from the above metrics that overall this plain vanilla regression model is doing a decent job. However, it can be significantly improved upon by either doing feature engineering such as binning, multicollinearity and heteroscedasticity fixes etc. or by leveraging more robust techniques such as Elastic Net, Ridge Regression or SGD Regression, Non Linear models.
—
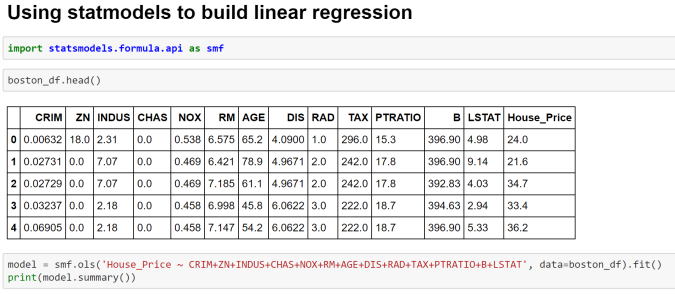
Image 9- Fitting Linear Regression Model using Statmodels
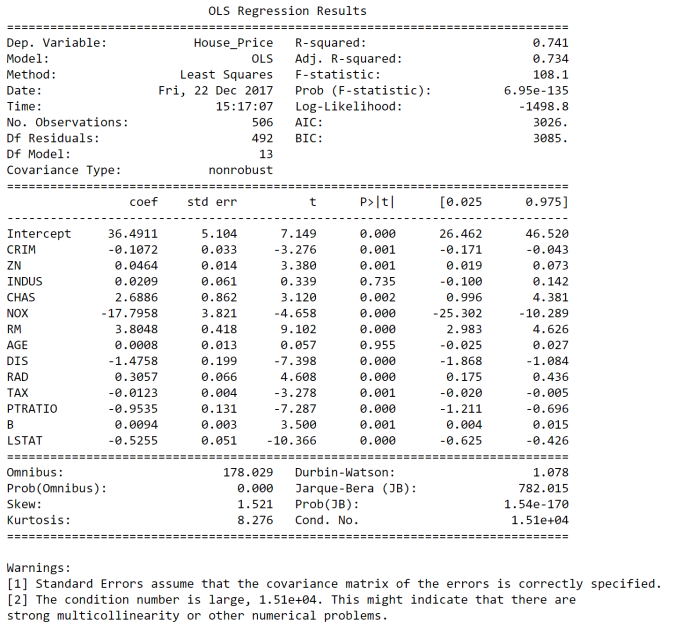
Image 10- OLS Regression Output
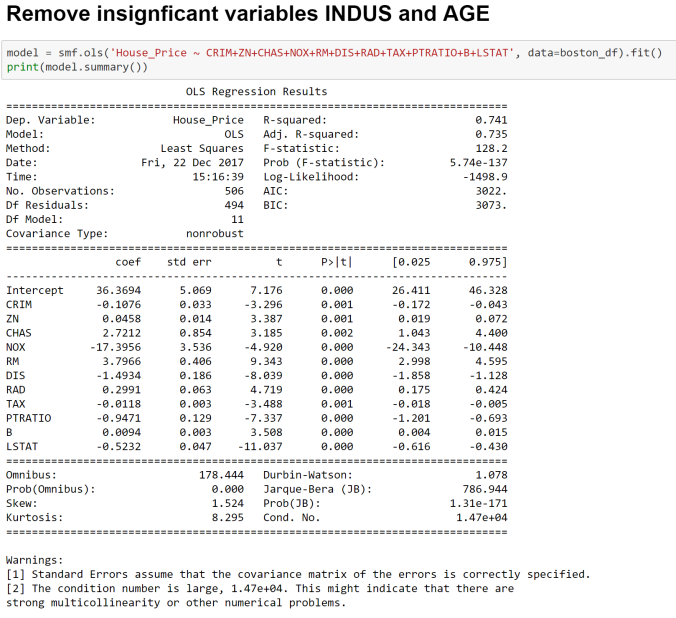
Image 11- Fitting Linear Regression Model with Significant Variables
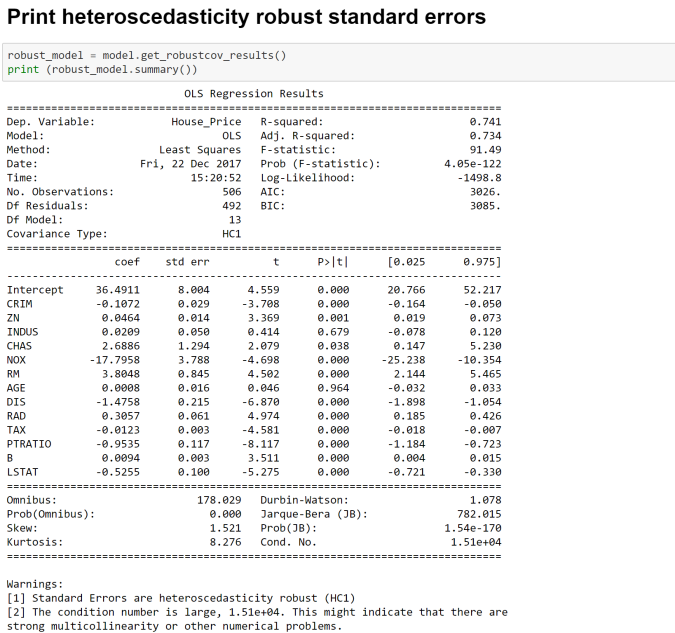
Image 12- Heteroscedasticity Consistent Linear Regression Estimates
More details on the metrics can be found at the below links-
Here is a blog with excellent explanation of all metrics
Cheers!
Pingback: Learn Python Step by Step | RP's Blog on data science
Pingback: Machine Learning Basics - ITechOasis
Pingback: Logistic Regression using Scikit Python | RP’s Blog on Data Science